
Uniswap.info Built On The Graph
A few days ago, Ethereum’s darling Uniswap celebrated its first birthday.
Uniswap is a decentralized exchange and an Ethereum streetwear pioneer created by Hayden Adams. It allows anyone to exchange ERC20 tokens, create a liquidity pool and earn income by providing liquidity.
In the last year, the project has evolved from simply being a DEX to becoming a DeFi primitive. With Uniswap, can earn market making income, users can seamlessly exchange any asset including tokenized real estate issued by and anyone can purchase swag on ! Currently, Uniswap has nearly ~$25M in liquidity for over 50 tokens.
Uniswap is an implementation of an x * y = k market making model, that was originally proposed by of Gnosis and further researched by . This model dictates that for a token pair of x and y, the size of each token’s liquidity pool will change but k will always remain constant; meaning future exchange rates will always fall along the equation’s original curve.
Learn more about Uniswap and its history !
Uniswap Info
When exchanging assets, users typically want a lot of information, like liquidity, volume, price changes and more. Luckily, The Graph has built the tools for dApps to easily index and query on-chain data so you can easily display the info on a website or internal dashboard.
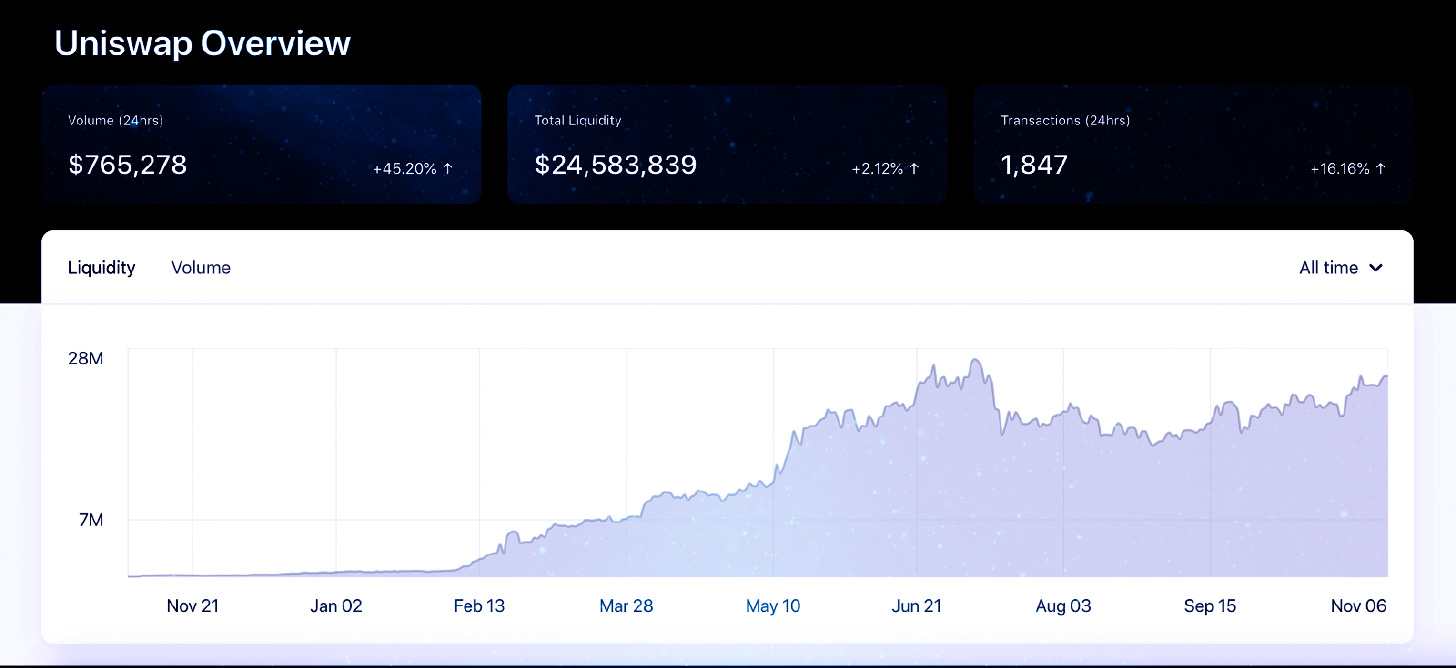
With the help of The Graph, Uniswap.info now captures historical transaction data!
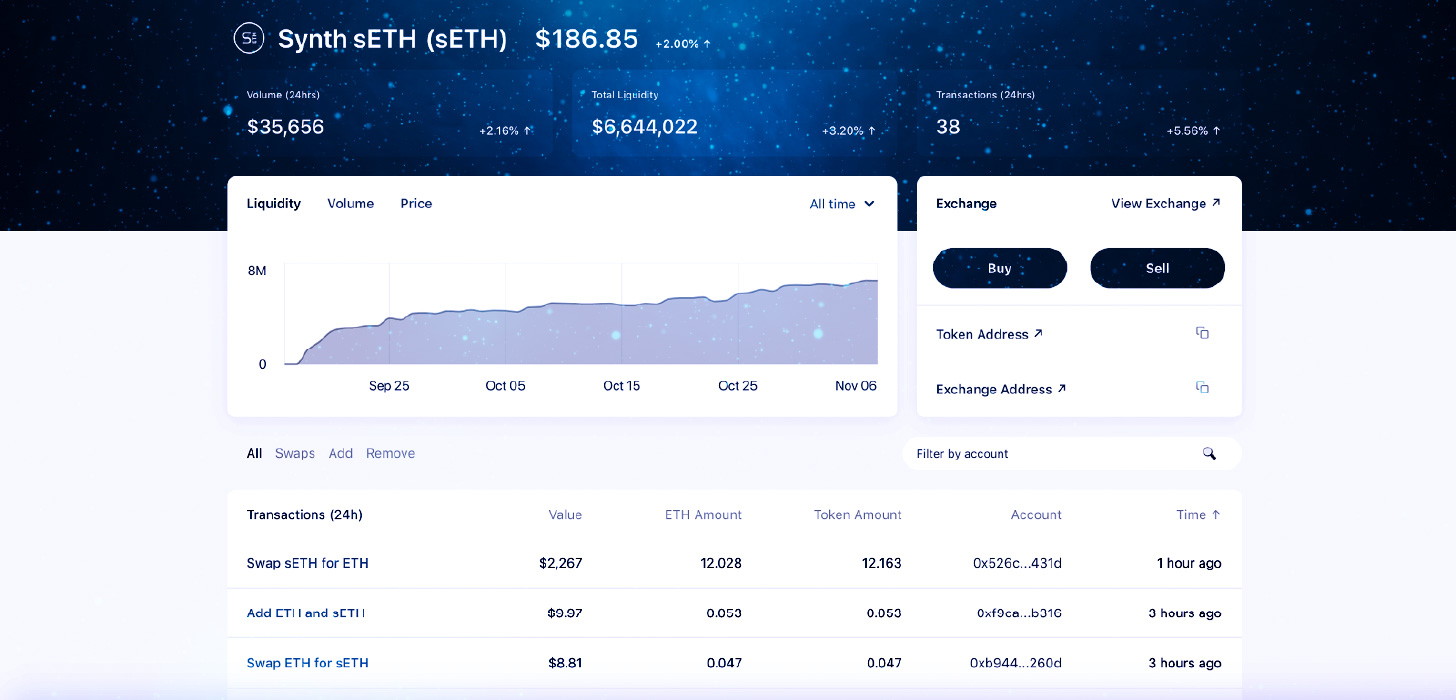
The defines which exchange data should be indexed, such as liquidity and volume, user data like pool balances and past transactions, and historical data including past trade and liquidity events. Users can now also make trades directly from Uniswap.info when they select a token, as well as view its liquidity, volume, price history and most recent trades.
Uniswap Subgraph
The Uniswap subgraph captures all exchange data including token purchases, liquidity creation, daily aggregates, historical volume, price changes and user activity. This allows for more interesting historical analysis that can be useful for multiple purposes:
- Calculating the total market making fees accrued (ROI) for taxes, to track your dApp’s market making income etc.
- Tracking historical demand for DeFi assets and ETH lockup value
- Observing user behavior trends such as a user’s market making history, their aggregate trades and past token balances
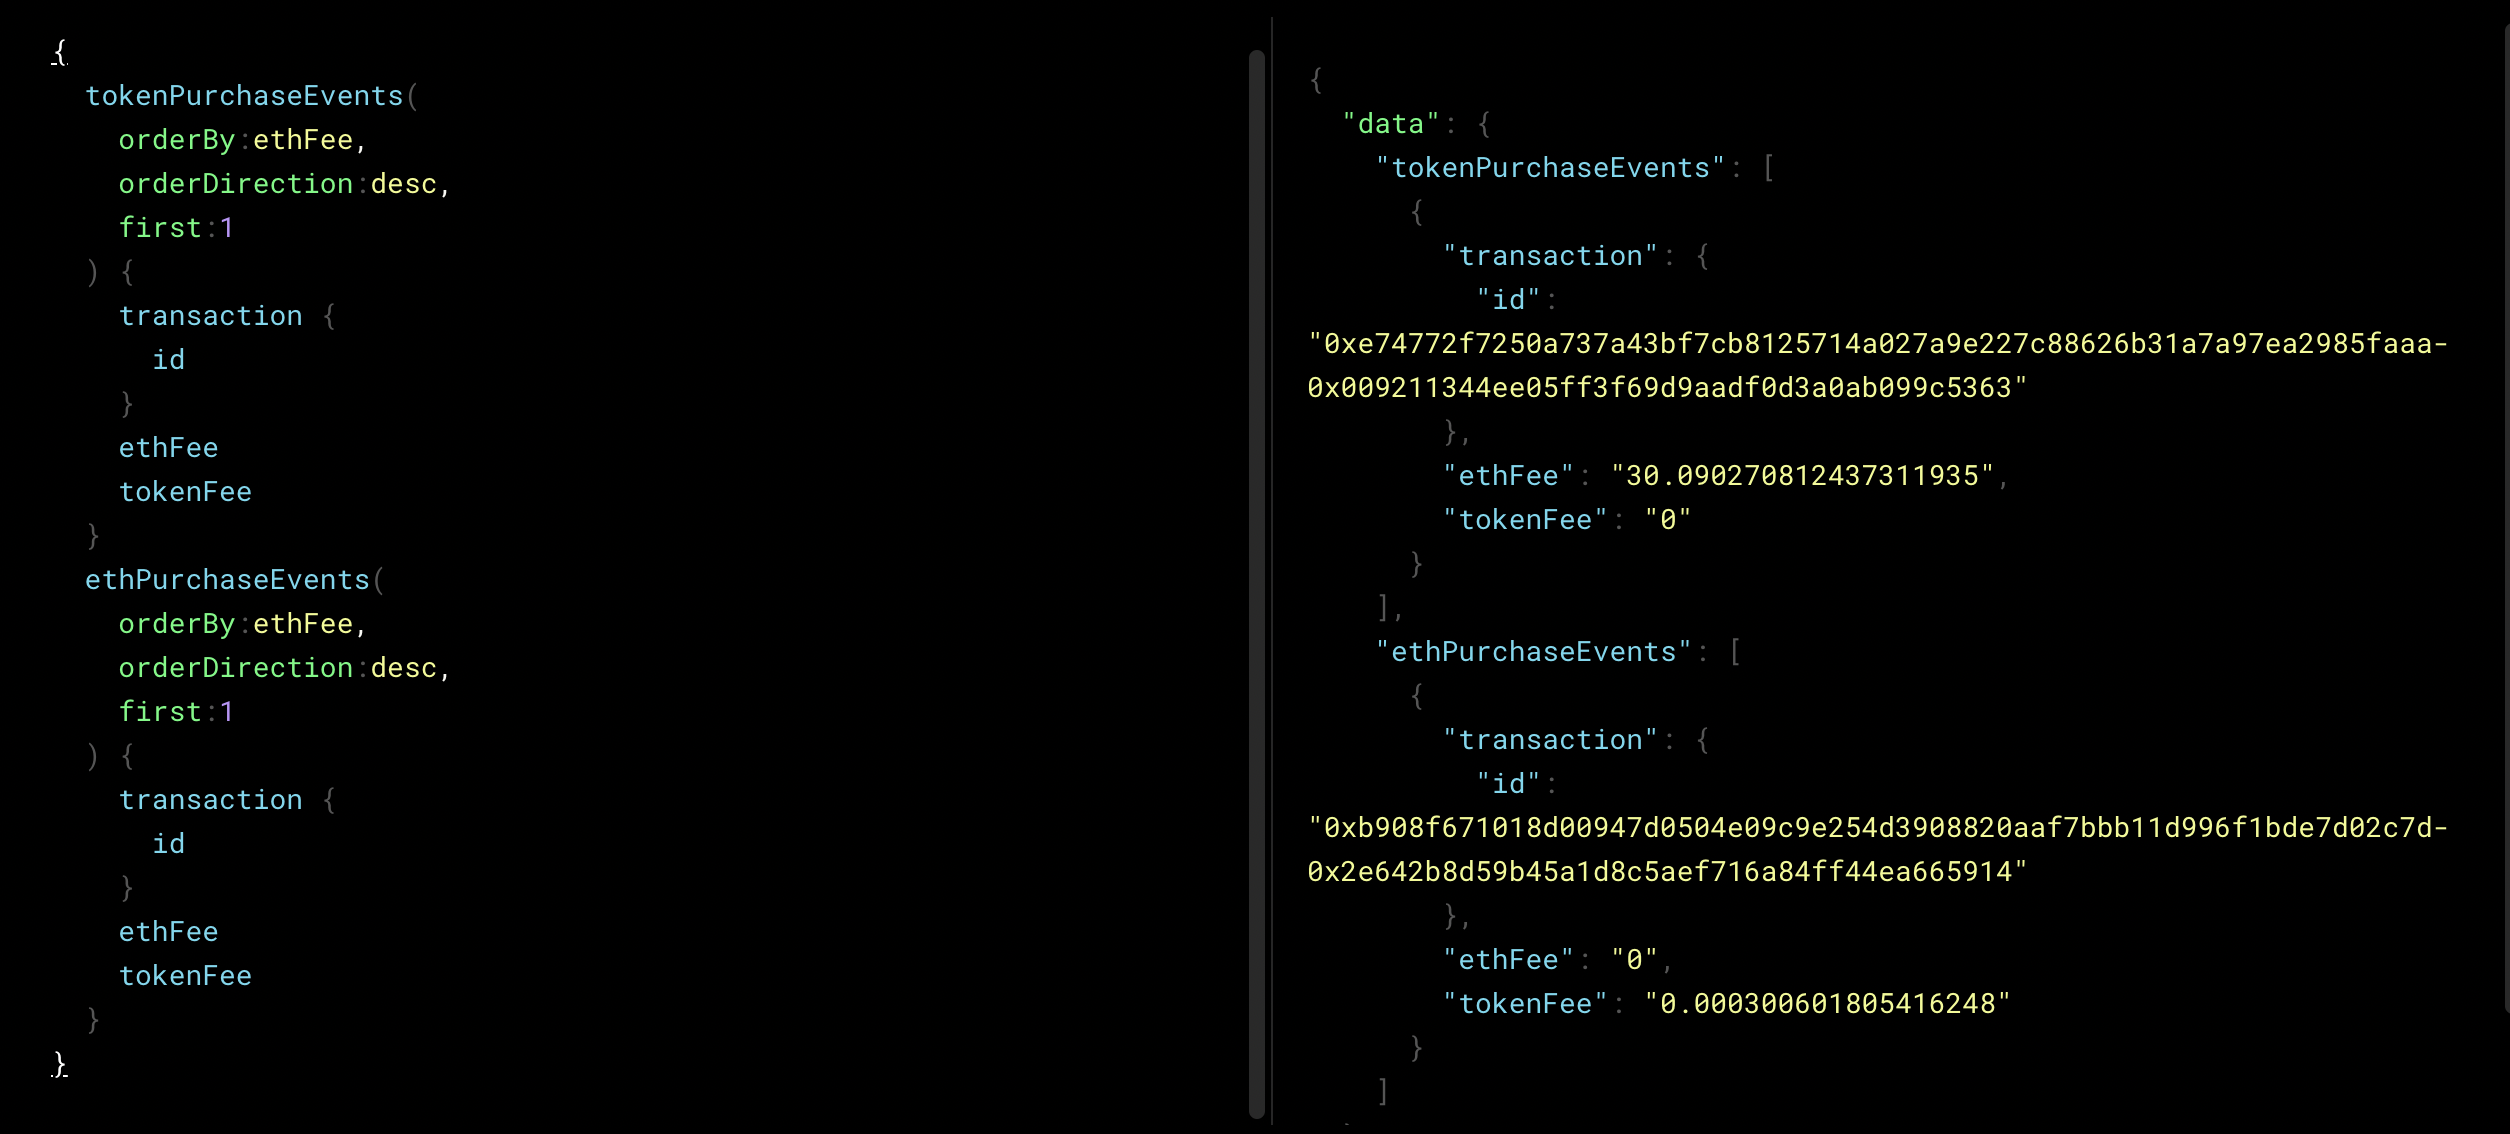
In the query above, we’re looking for the trades that had the highest fees - the fee that liquidity providers earn for market making on Uniswap. Specifically, we’re looking for the token and ETH purchases that accrued the highest tokenFee and ethFee. Users can also make more nuanced queries by transaction id, user address and purchase events to aggregate fees.
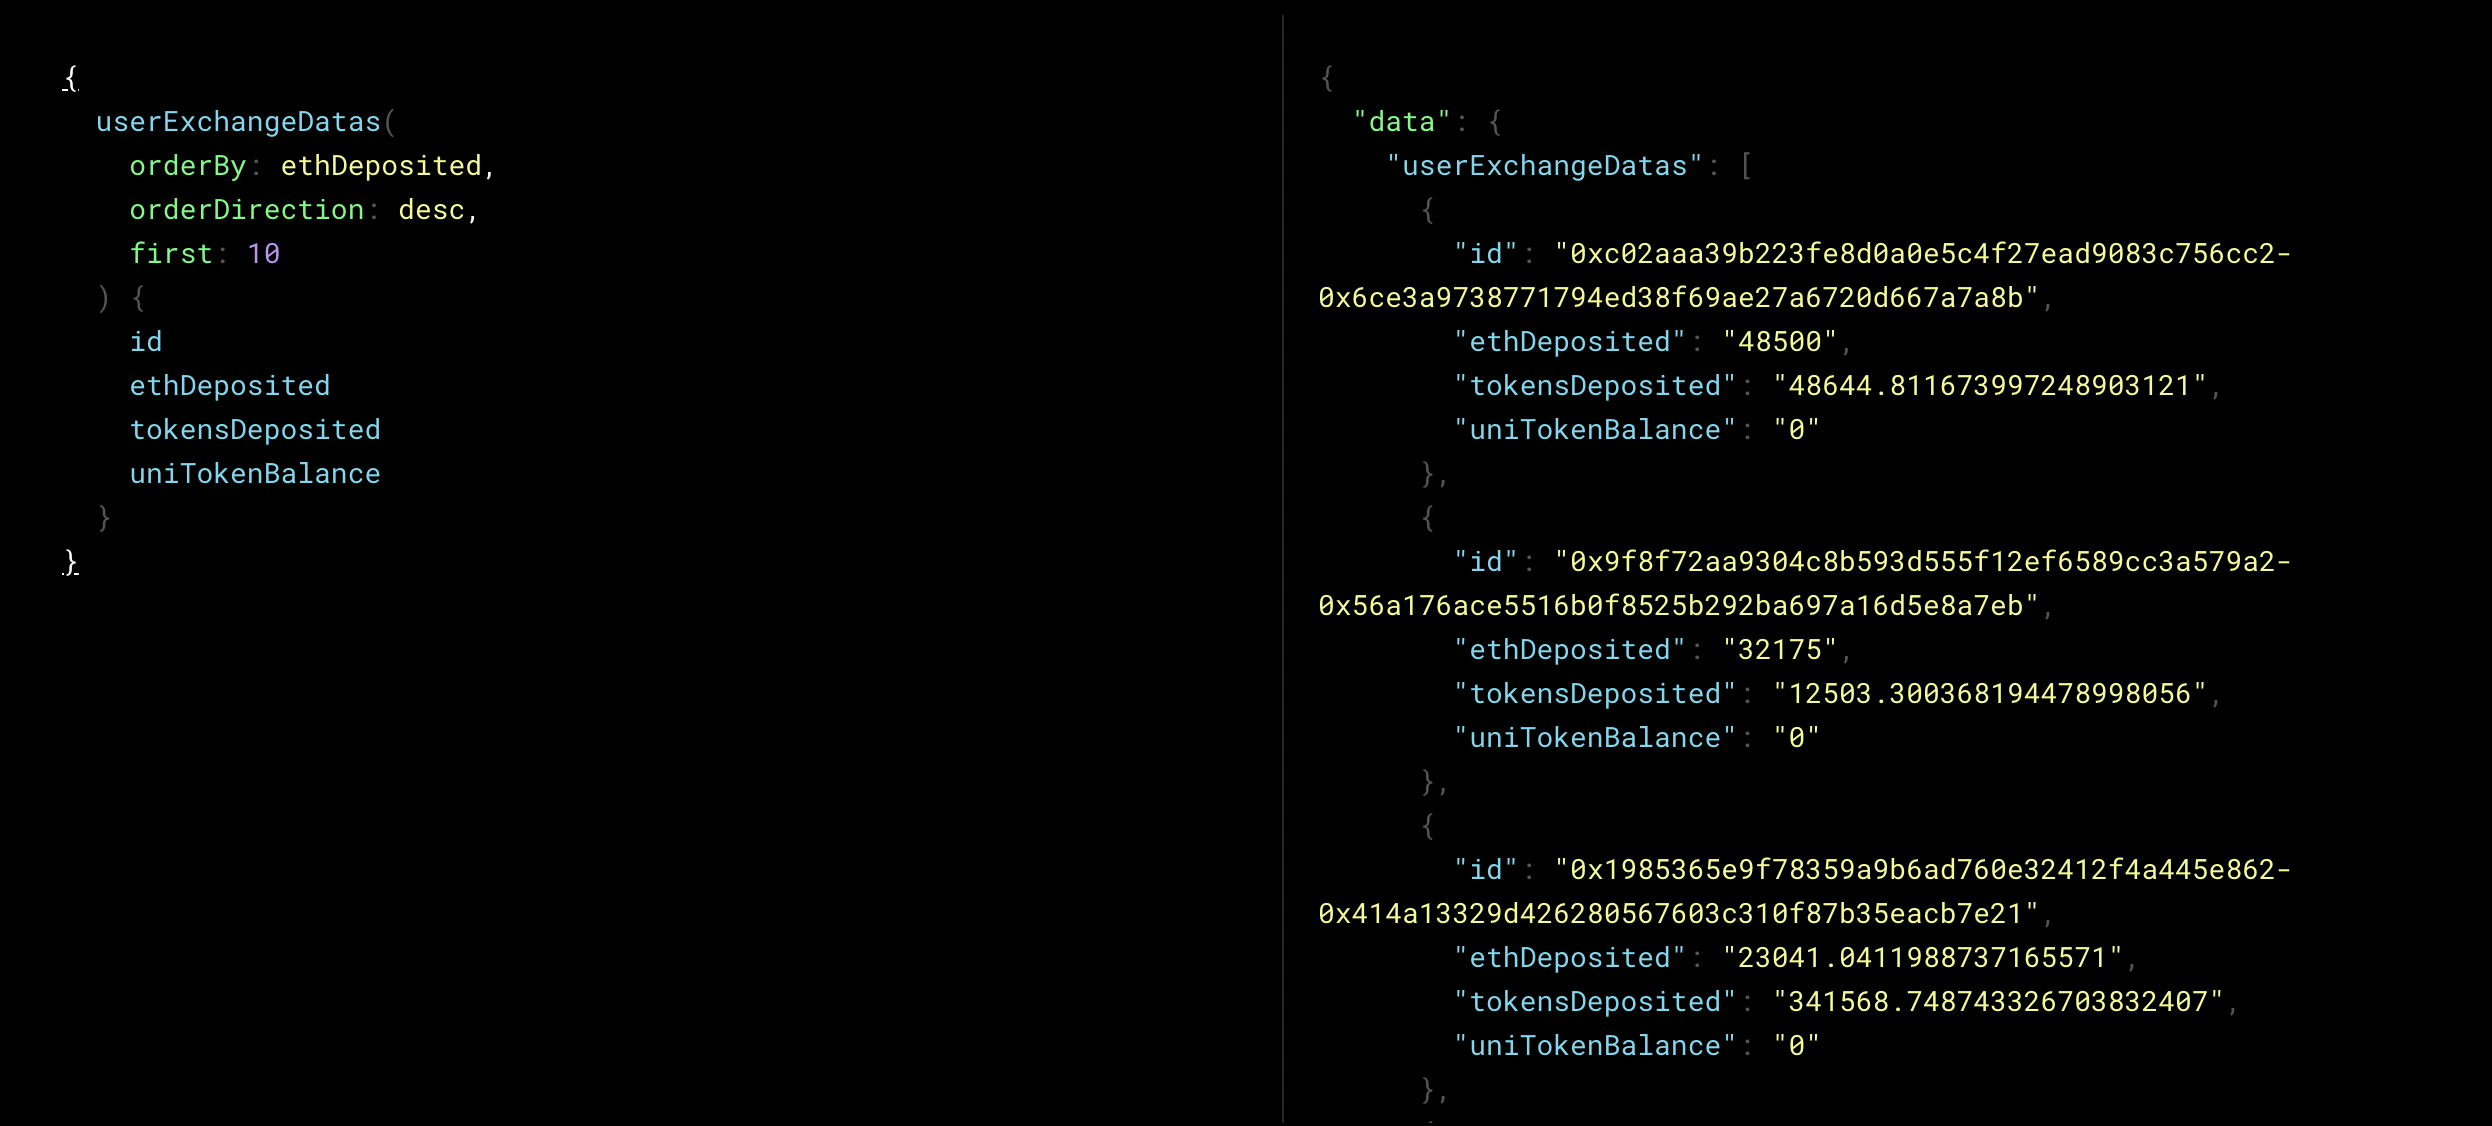
In this query, we’ve essentially created a leaderboard for Uniswap ETH whales where we’ve queried the top ETH liquidity providers in descending order of ETH deposited. This can help us better analyze user behavior, like keeping track of top market movers and observing the relationship between liquidity providers of ETH vs. other tokens. Other fields that can be queried about users include their address, assets bought and sold historically and total fees paid by that user.
Uniswap.info is just an example of what you can do with a subgraph and we’re excited about integrating with more DeFi applications to better meet their data needs. Subgraphs for USDC, Compound, Melonport, Betoken and many other DeFi apps have already been deployed!
Instead of building an indexer and running a centralized server you can easily index data, by building and deploying a subgraph. to learn how to deploy your own subgraph and query others!
You can also join the community on our to chat about launching a subgraph or building on The Graph ecosystem.
