Subgrounds: Subgraph Querying for Data Analytics
With over 40,000 subgraphs deployed and 1000+ subgraphs published on The Graph Network, The Graph has established itself as a crucial decentralized data provider for web3. The magic of The Graph revolves around subgraphs: a standardized ETLQ (Extract-Transform-Load-Query) recipe for blockchain data which, once published on The Graph Network and indexed by Indexers, allow users to query pre-modelled data via a GraphQL API. From Uniswap's analytics dashboard to DefiLlama, countless web3 dapps are using The Graph and subgraphs to source their data reliably and efficiently.
However, the fact remains that subgraphs and the rich data they provide were designed to be consumed primarily by frontend applications and are therefore not optimal for your typical data analytics use case. In this blogpost, we'll explore how we at Playgrounds Analytics unlock the potential of The Graph to a variety of data analytics use cases. Most of the techniques explored in this article are implemented in our open source Python library , but I will attempt to keep it implementation agnostic.
Leveraging Schema Introspection
One of the greatest advantages of GraphQL as opposed to other API standards such as REST is that introspection (i.e.: querying the structure of the API itself) is built-in GraphQL. What this means is that not only can you query data from the GraphQL API, but you can also query metadata about the API such as the list of all entities available on the subgraph, or the list of filtering parameters that one can use on a query.
For example, to get a list of all types defined for a given GraphQL API as well as their fields (if the type is an Object, i.e.: an entity type), you can query the __schema meta field using the following:
query {__schema {types {namekindfields {name}}}}
Executing this query on the official would return the following metadata (note: only the metadata for the UniswapDayData type is shown below for brevity).
{"data": {"__schema": {"types": [// …{"name": "UniswapDayData","kind": "OBJECT","fields": [{"name": "id"},{"name": "date"},{"name": "volumeETH"},{"name": "volumeUSD"},{"name": "volumeUSDUntracked"},{"name": "feesUSD"},{"name": "txCount"},{"name": "tvlUSD"}]}]}}}
The full introspection query, which fetches all the metadata of a GraphQL API, . (note: the same introspection query works for all GraphQL APIs, not just subgraphs!).
Introspecting GraphQL APIs unlocks many useful features for the purposes of data analytics, but we'll focus on two of them and how Subgrounds implements them: Automatic query generation and type checking/conversion.
Automatic Query Generation
Whereas a developer writing a subgraph-powered frontend application already knows the data and queries they need to achieve their goal, this is not so for the data analyst who must first explore the data in order to perform their analysis. The best way to achieve this is to pull as much data as possible into a desired data environment and use the latter to explore the data.
This process is made easier by using schema introspection because it is possible to programmatically populate a GraphQL selection with all of the available subfields. For instance, going back to the Uniswap V3 subgraph, given the first incomplete query on uniswapDayDatas below, we can use the result of our introspection query above to select all subfields of the uniswapDayDatas top-level field, thus querying all the available data related to this type of entity.
query {uniswapDayDatas {iddatevolumeETHvolumeUSDvolumeUSDUntrackedfeesUSDtxCounttvlUSD}}
This is analogous to a SELECT * FROM uniswapDayDatas SQL query.
Type Conversion
GraphQL introspection also allows us to perform intelligent type conversion which is especially useful when dealing with large numbers.
A lot of web3 assets such as ERC-20 tokens are often divisible to a very large number of decimals (18 decimals is the most common), which results in transactions containing very large numbers that cannot be represented with the usual 32 bit integer. Subgraphs represent these large numbers by using BigInt and BigDecimal types, which differ from the standard Intand Float type in that the values are represented as strings when queried via GraphQL.
Using GraphQL introspection, it's possible to tell which strings in the response data to a query are actually numerical values (and should therefore be converted to the appropriate type client-side) and which strings are "real" strings.
Automatic Pagination
A major challenge for data analysts working with subgraphs is querying large amounts of data to construct meaningful analysis. This is because subgraphs only allow developers to query 1000 entities (i.e.: rows) in a single query. For most frontend applications where you will rarely display more than a few entities per page, this isn’t a problem. However, to perform proper data analysis, you often need a lot more data, which means pagination is necessary.
The best way to paginate through all the entities in a given collection, as highlighted by The Graph's , is to use a unique field (usually the id of the entity) as a cursor and increment that cursor to get each subsequent batch of data. Here’s what that process can look like:
- Write your query with a filter on your unique field so that the number of entities to query and the filter value can be set as variables. Make sure that the ordering and order direction match your filter (by default, entities are ordered by
idin increasing order, hence why we use theid_gtfilter). - Run a first query with the filter value set to the smallest value possible (e.g.:
0for a String field likeid). - Grab the largest
idin the response data and use it as the filter value for your next query. - Repeat steps 2. and 3. while continuously updating the filter value until either no data is returned or you have queried enough entities for your needs.
The Graph's documentation provides a good explanation of how to paginate through large amounts of data, but it stops short of showing how to implement a pagination algorithm.
Here is a potential implementation of the pagination method in Python:
import requests# The GraphQL query string, we are querying Token entities# along with their id and symbolquery_str = """query($lastID: String, $numEntities: Int) {tokens(first: $numEntities, where: { id_gt: $lastID }) {idsymbol}}"""# The total number of entities we want to querytotal_entities = 10_000# Where we will accumulate the datadata = {"tokens": []}# Initial value of the lastID variableid_cursor = "0"while len(data) < total_entities:# Query the subgraphresponse = requests.post(url="https://api.thegraph.com/subgraphs/name/uniswap/uniswap-v3",json={"query": query_str,"variables": {"lastID": id_cursor,"numEntities": min(1000, total_entities - len(data))}})new_data = response.json()# Stop paginating if no data is returned (i.e.: we have queried# all entities in the collection)if len(new_data["data"]["tokens"]) == 0:break# Store new datadata["tokens"] += new_data["data"]["tokens"]# Update id cursor to get next pageid_cursor = new_data["data"]["tokens"][-1]["id"]
Data Flattening
When it comes to performing data analysis, tables are often (if not always) the preferred way to organize data. Tables, as opposed to JSON data, make it easy to perform row-wise (e.g.: average, sum, count) and column-wise (e.g.: projections, transformations) operations.
The data returned when querying subgraphs is represented in JSON, which makes it easy to parse from a frontend development point of view, but makes it harder to work with from a data analytics point of view, especially for highly nested data.
One solution is to flatten the data into one or more tables. With that said, flattening the data is opinionated and there is not always a clear way to do it. For instance, consider the following GraphQL query and resulting JSON data (from the Uniswap V3 subgraph):
query {pools(first: 10,orderBy: volumeUSD,orderDirection: desc) {idtoken0 {idsymbol}token1 {idsymbol}poolDayData(first: 7,orderBy: date,orderDirection: desc) {datevolumeUSDtoken0Pricetoken1Price}}}
{"data": {"pools": [{"id": "0x88e6a0c2ddd26feeb64f039a2c41296fcb3f5640","token0": {"id": "0xa0b86991c6218b36c1d19d4a2e9eb0ce3606eb48","symbol": "USDC"},"token1": {"id": "0xc02aaa39b223fe8d0a0e5c4f27ead9083c756cc2","symbol": "WETH"},"poolDayData": [{"date": 1688342400,"volumeUSD": "292557268.7100181519540379197139414","token0Price": "1957.978108402854641994905812228383","token1Price": "0.000510730940100097212103381521956495"},{"date": 1688256000,"volumeUSD": "223062416.8663179107819293416092063","token0Price": "1937.157933784268095208962073417337","token1Price": "0.0005162201710866622405192498506673977"},...]},...]}}
The above query fetches the 10 top liquidity pools by volume, information about the pools' tokens and a week's worth of price and volume data for each pool. The response data is not only highly nested, but also contains a nested list. There are two ways one could flatten the data:
1. Create two tables, one for pools and one for the daily datapoints with the later containing an additional column with the pool's id.
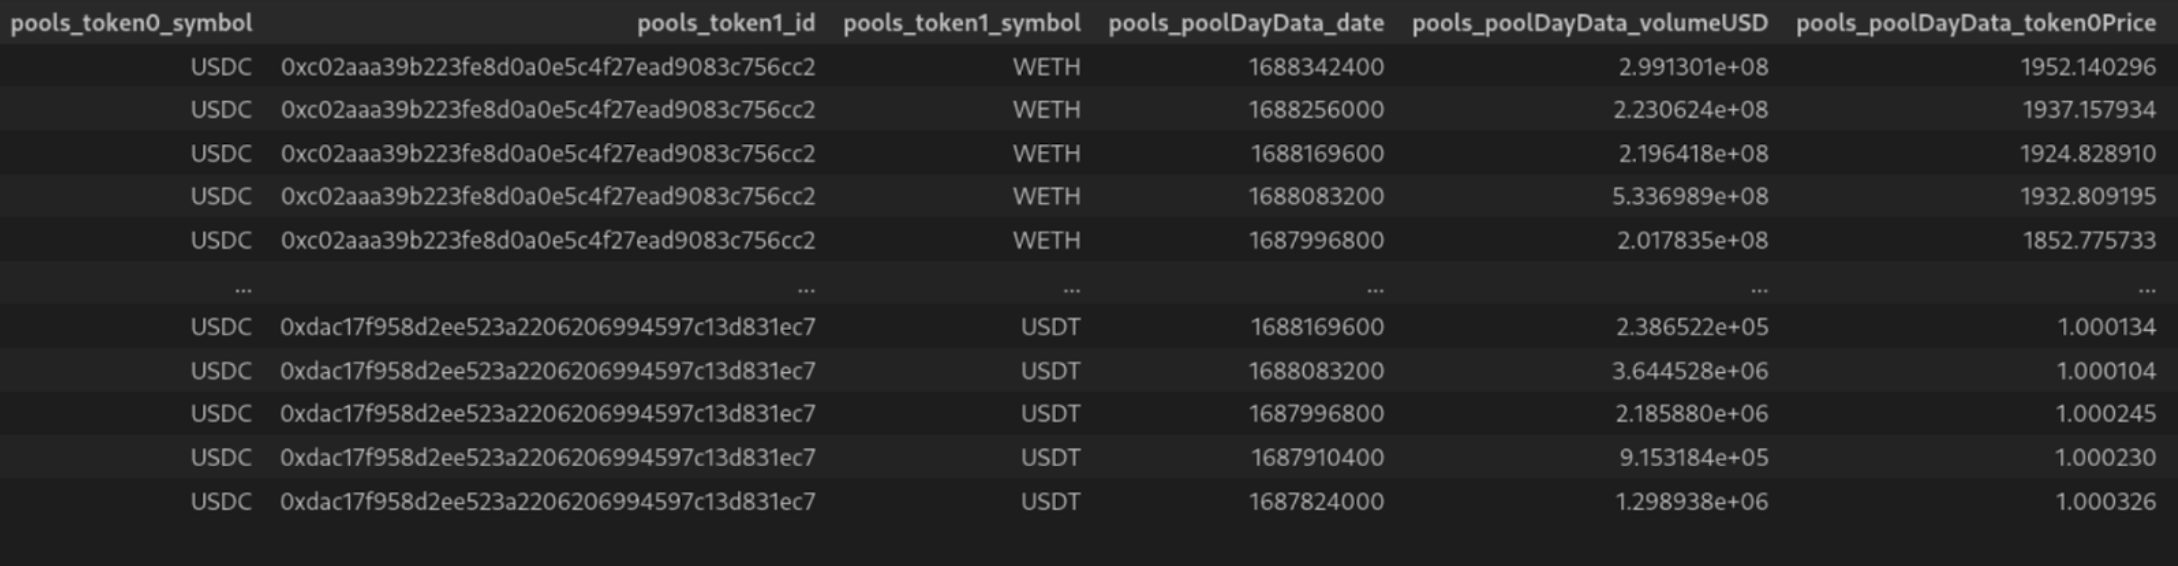
2. "JOIN" the two lists into one unified table such as to have the same pool data repeated for each daily data point.
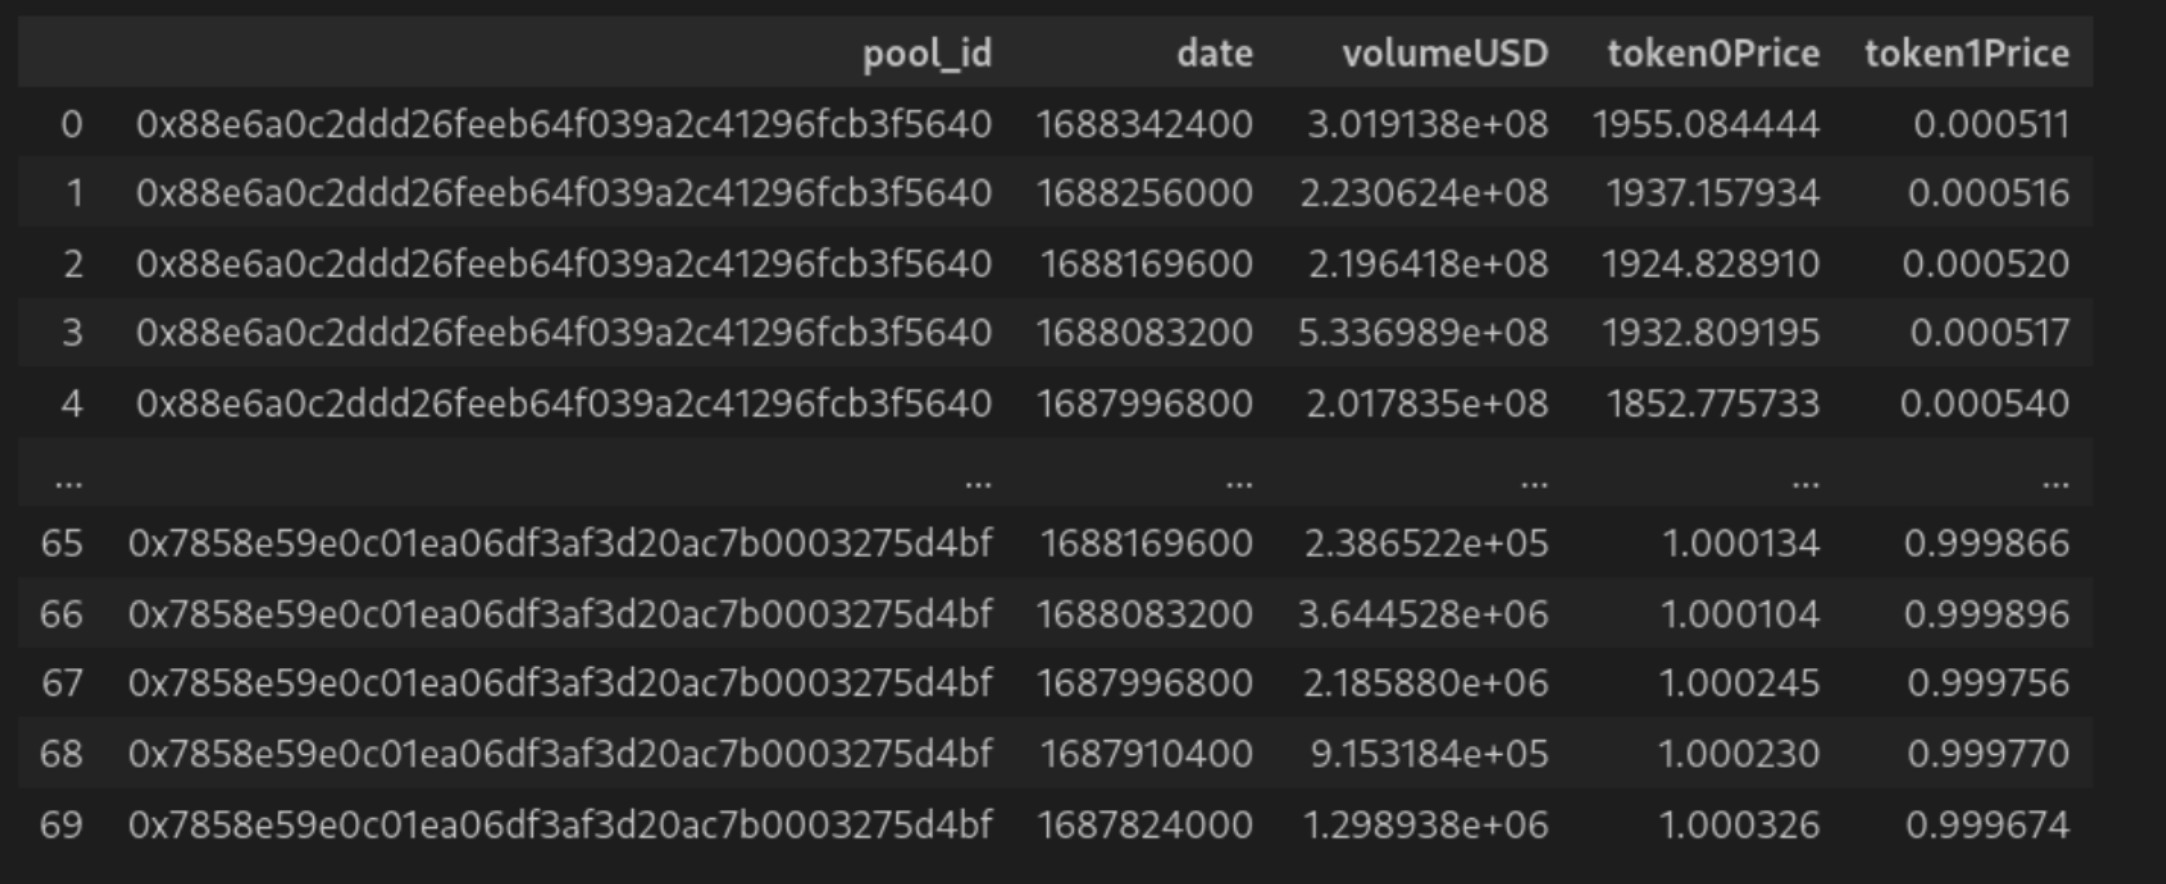
Regardless of which flattening method is used, the data is much more analysis friendly than its raw JSON counterpart.
Subgrounds: Putting it all Together
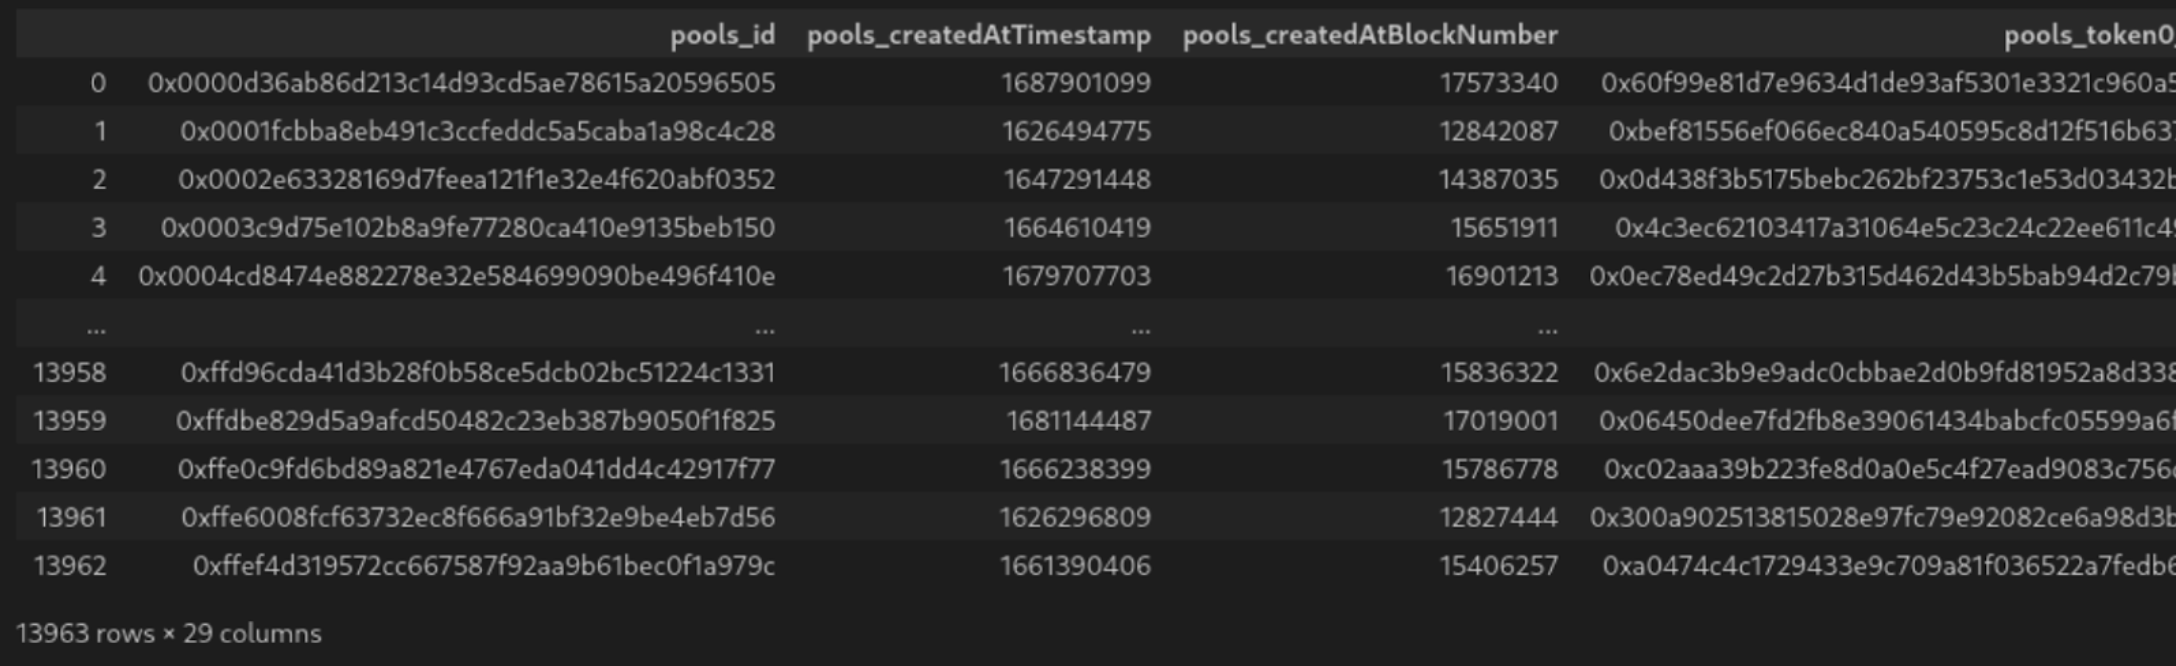
All the techniques described above are leveraged by the Subgrounds/Playgrounds Python open-source library which are designed to unlock the powers of subgraphs for data analysts. Here is a Subgrounds example that pulls all pools (and all their fields) from the Uniswap V3 subgraph and dumps it all in a pandas dataframe (note: there are around ~14,000 pools on the subgraph at time of writing, so setting first to 15 thousand will fetch all pools):
from subgrounds import Subgroundssg = Subgrounds()uniswap_v3 = sg.load_subgraph("https://api.thegraph.com/subgraphs/name/uniswap/uniswap-v3")sg.query_df([uniswap_v3.Query.pools(first=15_000)])
Here is a screenshot of the resulting dataframe:
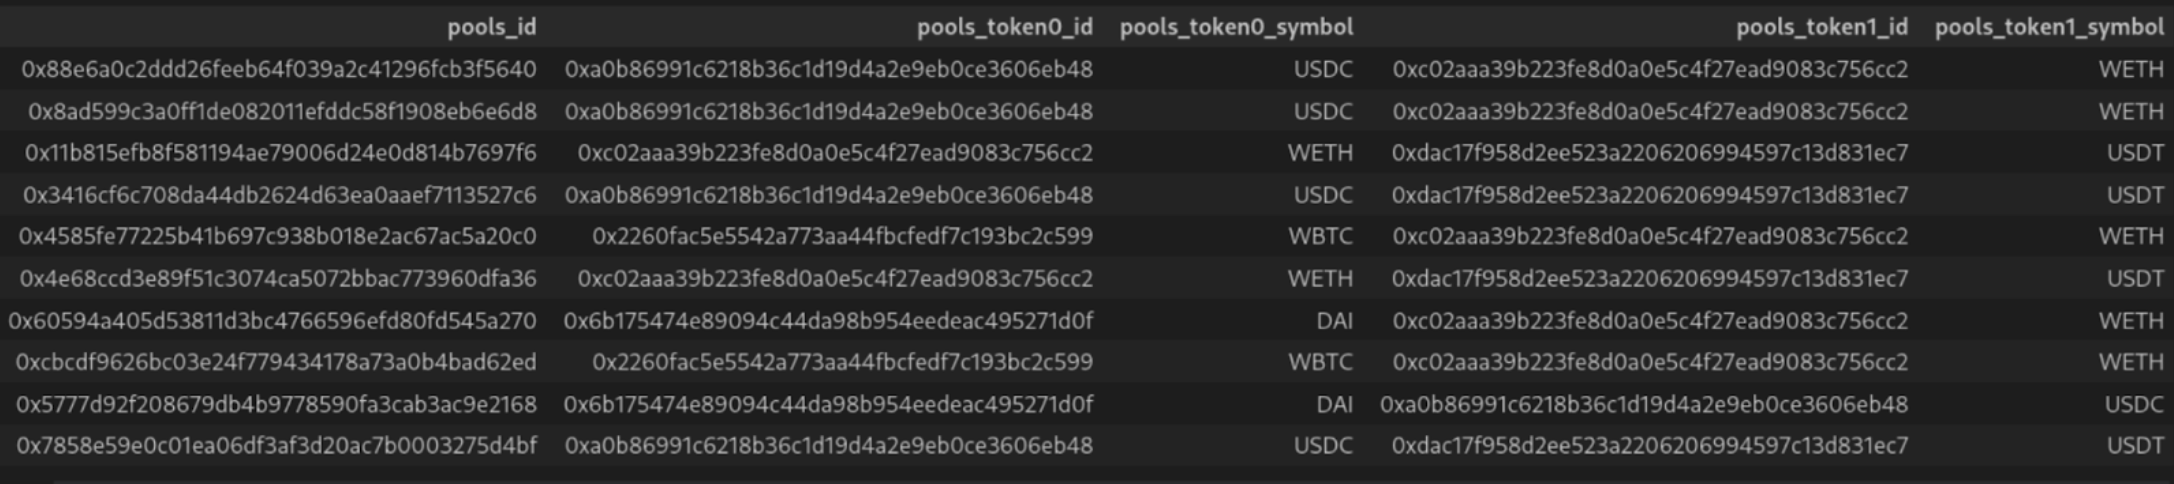
This 10 line code snippet leverages GraphQL schema introspection to automatically select all subfields of the pools toplevel field, automatic pagination to fetch up to 15,000 rows of data, JSON flattening to flatten the result into a nice table and type conversion to make sure that BigInt and BigDecimal fields end up as numerical values in our dataframe. Now that all the data has been downloaded into your Python environment, it is finally time for the real work to begin: analysis!
Conclusion
In this blogpost, we explored various techniques to improve the developer experience of using The Graph and subgraphs as data sources for large scale data analysis. We have seen how Subgrounds uses these techniques to provide an easy way to query data from The Graph and prepare it for data analysis. This demonstrates the viability of The Graph as a foundational web3 data infrastructure layer capable of powering more than just dApps.
To learn more about Subgrounds and Playgrounds as a whole, check out our and drop into our to talk about all things The Graph and web3 data!
Contribute to The Graph Builders Blog
As a decentralized project, we firmly believe that sharing knowledge is crucial for the growth and development of the entire ecosystem. The Graph Builders Blog is a platform for developers and those building with The Graph ecosystem to share their insights, experiences, and best practices related to building decentralized applications with The Graph.
By contributing to The Graph Builders Blog, you will have the opportunity to showcase your expertise, share solutions, and gain exposure to a community of like-minded builders. We are confident that your insights will inspire and educate others, as well as contribute to the vision of a fully decentralized future.
Perks of being an author on The Graph Builders Blog
- Once The Graph editors approve your blog, you will be featured on The Graph site, with reach to hundreds of thousands of readers, with you named as the author of the blog
- We will highlight and tag you in social media post, including nearly 300k twitter followers
- You will receive a “The Graph Builders Blog Author” POAP
- You will be able to add The Graph Builders Blog author to your LinkedIn and resume
To apply to be a contributor to The Graph Builders Blog, fill out this and we will get back to you.
About The Graph
The Graph is a suite of blockchain data infrastructure products that extract, process, and deliver scalable blockchain data solutions across 60+ networks. The Graph enables application developers, data analysts, AI agents, and enterprise teams that need structured, real-time access to blockchain data. Products include Subgraphs, Firehose, Substreams, and Amp. As of early 2026, The Graph has served over 1.27 trillion queries to more than 75,000 projects, powered by a network of independent Indexers around the world.
Follow The Graph on , , , and . Join the community on The Graph’s , join technical discussions on The Graph’s .